Everyone has heard the saying, “a picture is worth 1000 words”, but do you know how much a 3D scan is worth?
Technological advances have provided many new and useful tools for measuring, re-creating, and, in other ways, characterizing manufactured parts that were never available or even imaginable to our predecessors. One such advancement has been in the development of accurate 3D scanning technology. New capabilities continue to emerge in the areas of data collection, evaluation, and analysis.
Nowadays, many manufactures are incorporating 3D scanning to supplement more traditional approaches to dimensional inspection such as the use of hand tools, optical measurement devices, and even CMM touch probes. The advantages of 3D scan data are many, but chief among them is the vastly larger number of data points that can be collected over a specific area very quickly, leading to much higher resolution provided by this data over traditional methods.
In the areas of quality assurance and dimensional inspection, scanning technology and techniques have already made significant in-roads. For inspection schemes requiring the application of GD&T, scanning can provide additional critical information that goes far beyond a number on a spreadsheet. Let’s take a look at one example of Profile to Surface measurement to illustrate this.
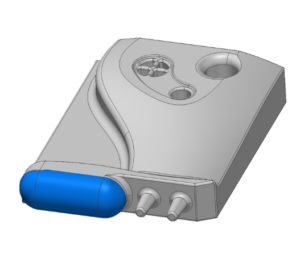
Here is a typical example of a simple part and simple dimensional layout. The focus is on the Profile to Surface dimension, which is failing. According to the GD&T measurement, the profile measurement is .00083 in. and the tolerance is .0008 in.


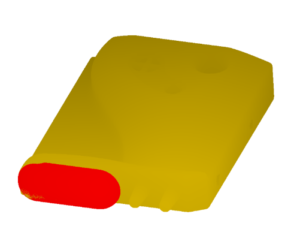
Here we see the same view as above except looking at the data point cloud instead of CAD. Notice that the red area (which represents the area over which profile is to be measured) is composed of thousands of individual points, 230,984 points, to be exact. Compare this to the number of points that might be typically collected in a CMM touch probe inspection (15-50, perhaps).

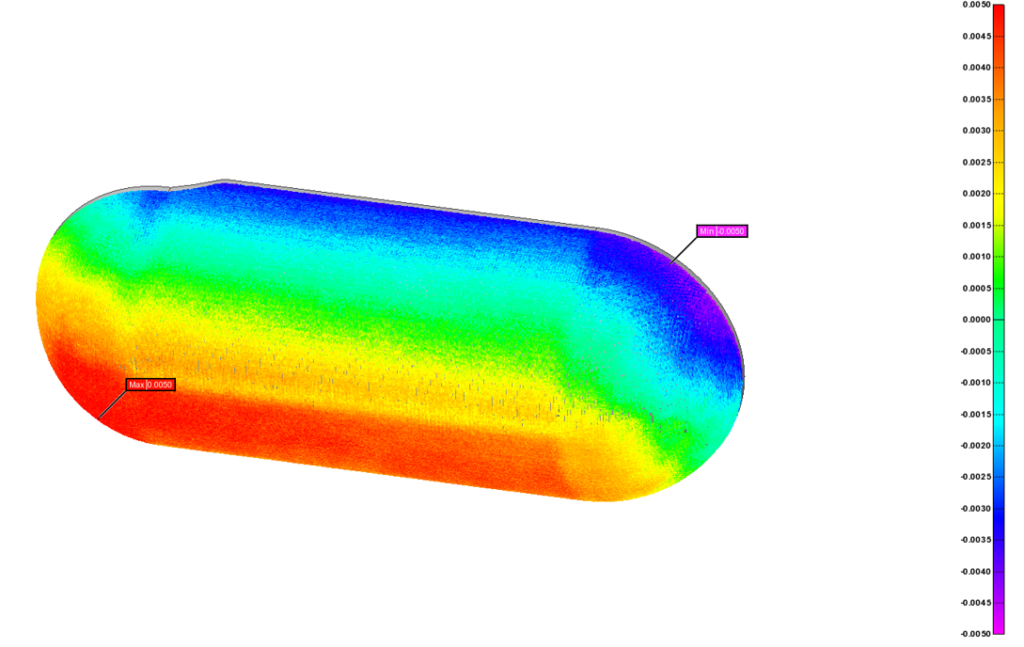
Above we see the color deviation map developed from comparing the CAD surface and scan data for the profile area. The first thing one will notice is that the color distribution (deviations to the inside and to the outside of CAD) is not uniform. In other words, the part does not deviate uniformly from the CAD model. The second thing to notice is that there is a clear shift of the deviation in a specific direction with respect to the CAD model (the part is shifted toward the red side and away from the blue side with respect to the CAD). Evaluation with 3D scan data not only tells us of a failing GD&T feature measurement, but it can give us detail into how the feature is failing in size, form, and position.
Of course, profile to surface is not the only measurement that is capable of being accurately evaluated. Flatness, true position, parallelism, all GD&T measurements, as well as simple measurements such as diameter, radius, and distance can be evaluated accurately and easily with outputs of both tabular and visual detail.
How does this apply in the real world? Additional information made available through 3D scan data can be critical for many applications in a wide variety of industries. One such example is in the iterative process of mold development and validation. Knowing not only where a mold is failing, but how and why it is so is basic to the mold maker’s art. The granular nature of scan data and analysis can provide such critical data before a design is committed to and steel is cut.
Considering the cost in terms of time, materials, and labor, a “picture” such as that provided by 3D scanning can save a company tens of thousands of dollars, or more.
So, the next time you consider using 3D scan data for your parts characterization ask yourself, “What is a picture worth?”
